nagios服务端配置及客户的安装配置
1.上面我讲了一些nagios服务端的安装和简单的配置,现在来讲一下服务端监控多台服务器的以及被监控端的安装配置。
2.nagios 服务端的配置
(1).首先默认安装好后,nagios就创建好了一个分组和一些服务,这个文件就是localhost.cfg文件。现在我们要创建自己的文件
把nagios.cfg里面的定义localhost.cfg这个注释掉,然后在开启hostgroup.cfg,host.cfg,services.cfg这三个文件。我把这三个文件
放在conf目录下便于管理。
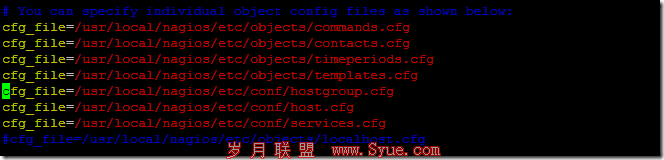
注:这些文件及相关目录原先是没有的,要自己创建并授权给它们
(2).要创建自己的组就先要在contacts.cfg里面定一个自己的联系人。
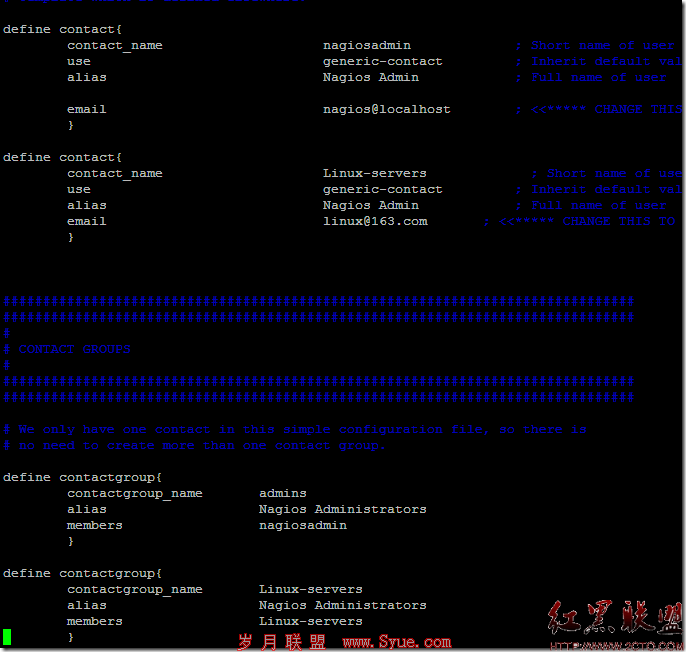
Linux-servers是我自己建的联系人各联系组。
注:如果不建这个联系人和组,在后面的hostgroup.cfg里面不能定义自己的主机组员。
(3).现在来建自己的监控主机、监控服务,监控组。
先讲一下他们三者的关系,监控组(hostgroup.cfg)包含了监控主机(host.cfg)包含了监控服务(services.cfg)
hostgroup.cfg->host.cfg->services.cfg
只要有一个不在就会报错。
检查nagios.cfg这个文件的报错信息是
/usr/local/nagios/bin/nagios -v /usr/local/nagios/etc/nagios.cfg
可以看到你哪里配置错了,我也是通过这个来排错的。
1.hostgroup.cfg
define hostgroup {
hostgroup_name Linux-servers
alias Linux-servers
members CentOS
}
2.host.cfg
define host {
host_name CentOS
alias server,host-pnp
address 192.168.1.8
contact_groups Linux-servers
check_command check-host-alive
max_check_attempts 5
notification_interval 10
notification_period 24x7
notification_options d,u,r
}
3.services.cfg
define service {
host_name CentOS
use local-service,srv-pnp
service_description CPU
check_period 24x7
max_check_attempts 4
normal_check_interval 1
retry_check_interval 1
contact_groups Linux-servers
notification_interval 10
notification_period 24x7
notification_options w,u,c,r
check_command check_nrpe!check_cpu
}
define service {
host_name CentOS
use local-service,srv-pnp
service_description CPU_load
check_period 24x7
max_check_attempts 4
normal_check_interval 1
retry_check_interval 1
contact_groups Linux-servers
notification_interval 10
notification_period 24x7
notification_options w,u,c,r
check_command check_nrpe!check_load
}
//services.cfg 这里只给出了两个,其它的按自己的需要添加就行了。
重启nagios之后先检查一下有没有错误了,没有的话就重启一下
service nagios restart
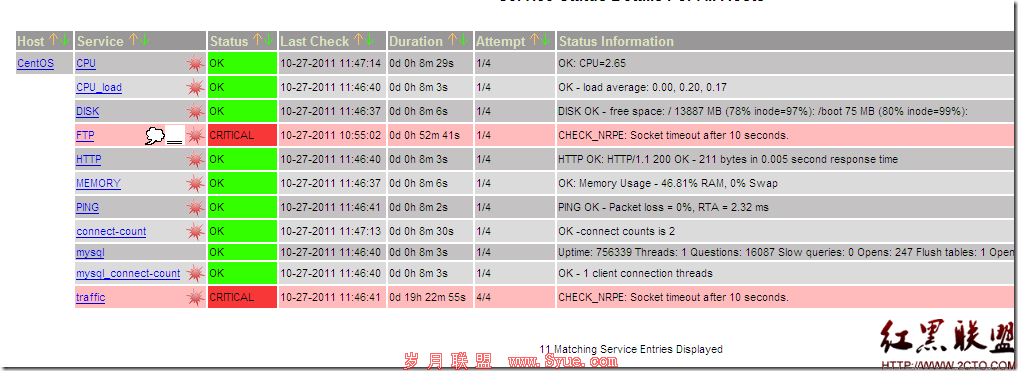
上面的图是我配好后的结果,现在来配置被监控端。
3.nagios 被监控端的配置。
(1).安装nagios-plugins
如果后面的configure没有检查到mysql这一项,看一下mysql-devel有没有安装,没有安装一下。
tar –xvf nagios-plugins-1.4.15.tar.gz
cd nagios-plugins-1.4.15
./configure
make && make install
(2).安装nrpe
tar –xvf nrpe-2.12.tar.gz
cd nrpe-2.12
./configure
make all
make install-plugin
make install-daemon
make install-daemon-config
make install-xinetd //这个是用xinetd来管理nrpe的启动和关闭的,可以加上也可以不加上。
(3).到些被监控的软件装好了,还要装一下snmp来收集数据,安装和配置net-snmp我已经在前面说过了,这里就不说了。
现在来配置一下监控项(nrpe.cnf)
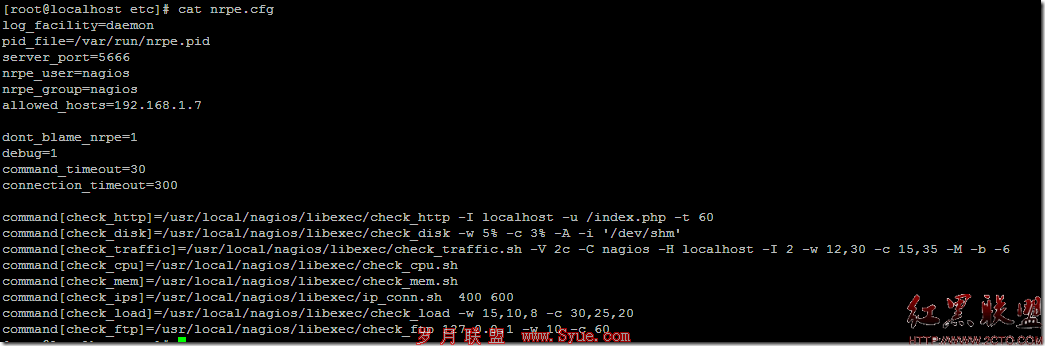
log_facility=daemon
pid_file=/var/run/nrpe.pid
server_port=5666
nrpe_user=nagios
nrpe_group=nagios
allowed_hosts=192.168.1.7
dont_blame_nrpe=1
debug=1
command_timeout=30
connection_timeout=300
command[check_http]=/usr/local/nagios/libexec/check_http -I localhost -u /index.php -t 60
command[check_disk]=/usr/local/nagios/libexec/check_disk -w 5% -c 3% -A -i '/dev/shm'
command[check_traffic]=/usr/local/nagios/libexec/check_traffic.sh -V 2c -C nagios -H localhost -I 2 -w 12,30 -c 15,35 -M -b -6
command[check_cpu]=/usr/local/nagios/libexec/check_cpu.sh
command[check_mem]=/usr/local/nagios/libexec/check_mem.sh
command[check_ips]=/usr/local/nagios/libexec/ip_conn.sh 400 600
command[check_load]=/usr/local/nagios/libexec/check_load -w 15,10,8 -c 30,25,20
command[check_ftp]=/usr/local/nagios/libexec/check_ftp 127.0.0.1 -w 10 -c 60
这里有几个是没有的要自己去网上找,然后下载下来放到/usr/local/nagios/libexec/下面并给执行权限,拥有者nagios。(check_traffic.sh,check_cpu.sh,
check_mem.sh,ip_conn.sh)
(4)监控mysql数据库和远程主机还需要在服务端的"commands.cfg"配置一下。
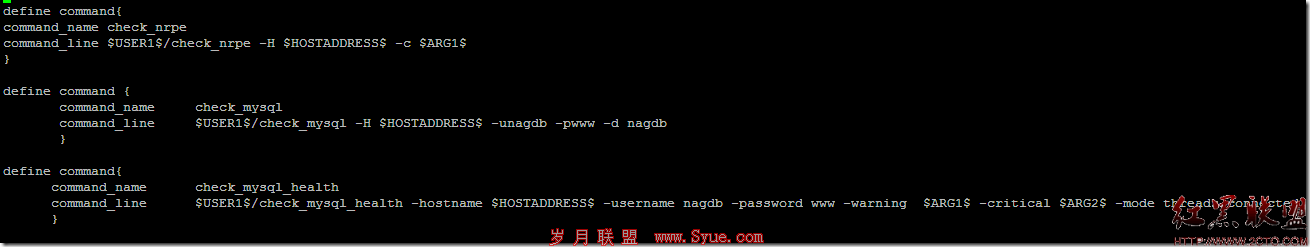
define command{
command_name check_nrpe
command_line $USER1$/check_nrpe -H $HOSTADDRESS$ -c $ARG1$
}
define command {
command_name check_mysql
command_line $USER1$/check_mysql -H $HOSTADDRESS$ -unagdb -pwww -d nagdb
}
define command{
command_name check_mysql_health
command_line $USER1$/check_mysql_health -hostname $HOSTADDRESS$ -username nagdb -password www -warning $ARG1$ -critical $ARG2$ -mode threads-connected
}
随便找一个位置放到commands.cfg文件里就行了。
到此就配置完了
摘自 HY_51CEO 的BLOG